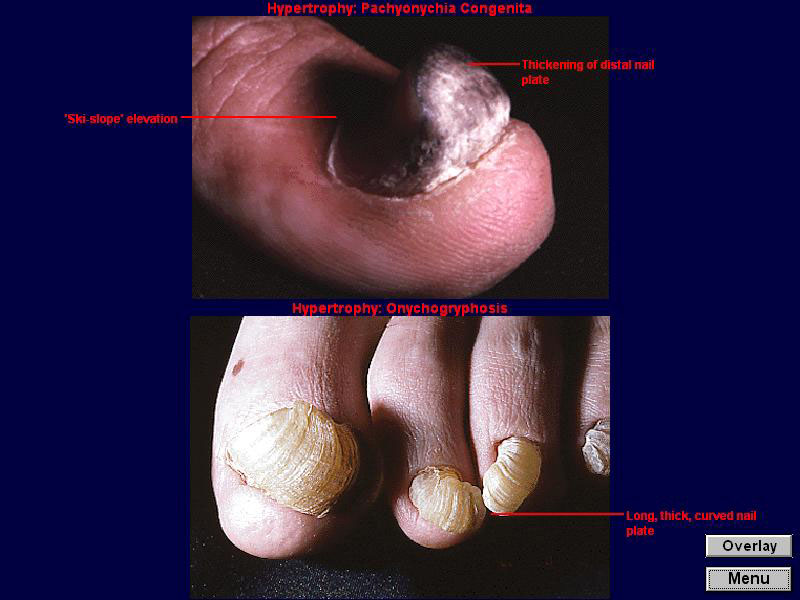
Figure 10. A split screen obtained using the image atlas. The upper image in the screen shows hypertrophy-pachyonychia congenita, and the lower image is hypertrophy-onychogryphosis. The overlay, consisting of red text and arrows is toggled on.