The Ultraviolet Index: A Useful Tool.
Published Web Location
https://doi.org/10.5070/D35925w4hqMain Content
The Ultraviolet Index: A Useful Tool
John P. Kinney, MD1, Craig S. Long2 , Alan C. Geller, RN, MPH3
Dermatology Online Journal 6(1):2
1Palm Beach Medical Group, West Palm Beach FL 2National Weather Service, National Meteorological Center, Washington, DC 3Boston Medical Center, Boston, MA
Abstract
The Ultraviolet Index was developed in the United States in 1994 following successful use of ultraviolet (UV) alerts in other countries. This daily National Weather Service prediction is a calculation which integrates five data elements to yield the amount of UV radiation impacting the surface (1m2) at solar noon in 58 of the largest US population centers. This simple numeric prediction is then categorized by the Environmental Protection Agency into five "exposure levels" with protective actions recommended for each level. This information is disseminated through the media. Daily reminders seem to affect awareness and behavior in Canada, but US surveys indicate the need for better understanding through educational graphics. Comparing the UV Index to a precipitation prediction has merit in that it links a familiar daily prediction with implied appropriate protective measures. Graphics link the ideas that "when it rains it pours and when it shines it radiates." Beginning in schools, camps, and dermatology meetings, using the rain/shine analogy, a wider exposure to the Ultraviolet Index is proposed.
Introduction
With skin cancer rates exceeding that of most other cancers [
1] the medical community has addressed the problem by encouraging behavior modification aimed at protection from and avoidance of ultraviolet (UV) radiation exposure. The Australians led the way, following up on their successful 1981 SunSmart Sid Seagull campaign with legislative enactments including decreasing sales tax on sun screens, occupational health and safety regulations for outdoor workers, a "no hat, no play" school policy, and daily ultraviolet alerts.[2,3]| Table 1. Brief History of Development of Ultraviolet Index |
|---|
|
 |
| Figure 1 |
|---|
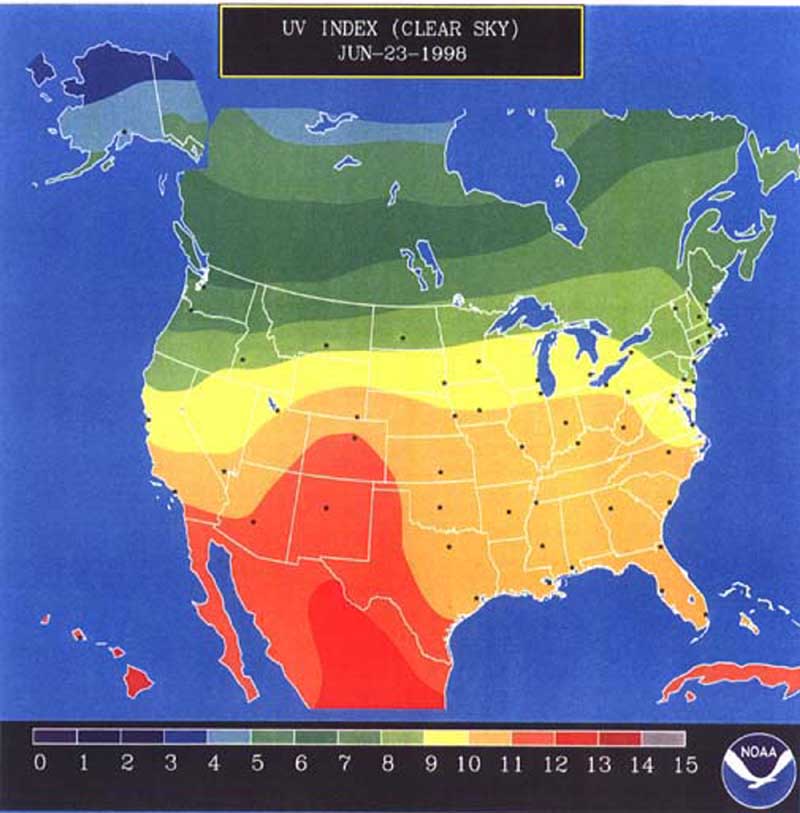
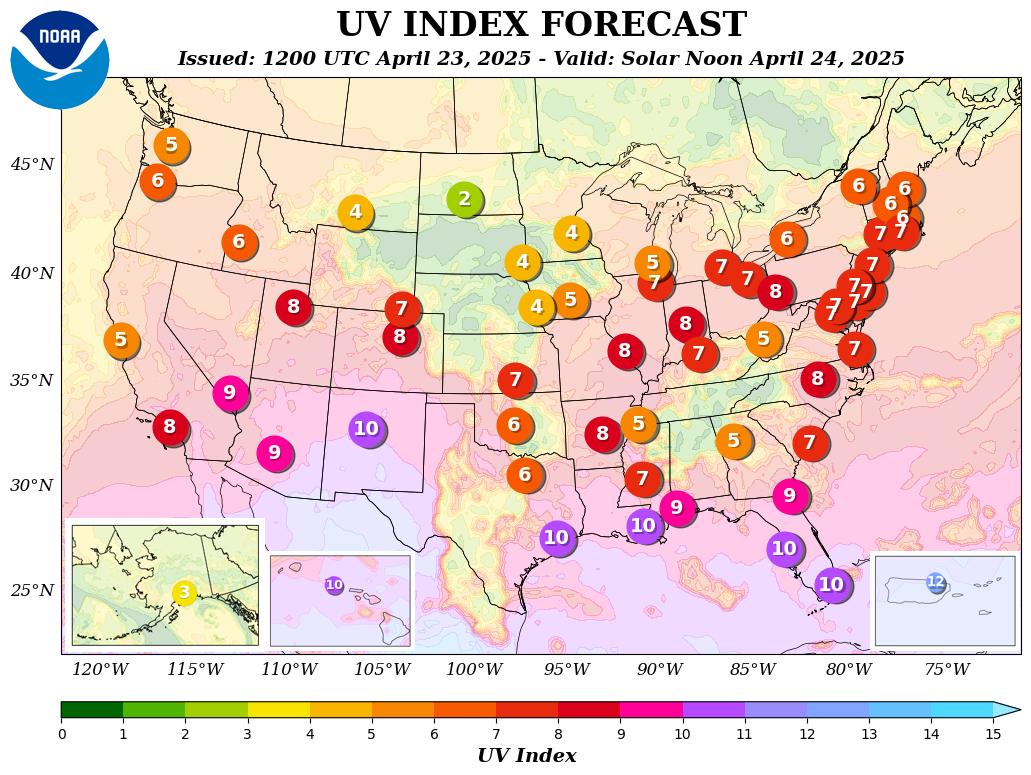
New Zealand (in 1987) and Canada (in 1992) developed public awareness campaigns including daily predictions of ultraviolet strength. (Table 1) In 1994, the United States Environmental Protection Agency (EPA) and National Weather Service (NWS) developed and validated the Ultraviolet Index, a daily prediction for the quantity of dangerous ultraviolet radiation impacting our largest population centers.[
4] (Figure 1) Dr. Koh's 1996 editorial was the first to bring this new alert to dermatologic attention.[5] Surveys have documented the UV Index's wide dissemination and usefulness, but have shown inconsistent understanding of this daily value.[6,7] Comparing the Ultraviolet Index to a prediction we all understand, the rain forecast, can increase public understanding of the Ultraviolet Index as a preventive/protective health tool.What is the Ultraviolet Index?
| Table 2. Elements of the Ultraviolet Index | ||||||||||
|---|---|---|---|---|---|---|---|---|---|---|
| Latitude and Date of Year determine the solar zenith angle. This is the angle at which light (including UV radiation) travels through the atmosphere.
A low vs. high solar zenith angle means direct vs. obtuse path through the atmosphere with the least vs. greatest amount of
interaction with the ozone layer, resulting in relatively higher vs. lower amount of UV radiation reaching the earth's surface. Ozone in the stratosphere absorbs all of the UV-C, partially absorbs UV-B, but none of the UV-A. The greater the amount of ozone in the stratosphere the more UVB radiation is absorbed. As Elevation increases, the distance the UV light travels through the atmosphere decreases and its intensity increases. (6-10%/1000 feet) Clouds either reflect, transmit, or absorb UV radiation depending upon their thickness in a manner quite similar to visible radiation. Thus as cloud cover increases, the amount of UV reflection increases and transmission decreases. Other local factors modifying the amount of UV radiation reaching the surface which are not currently accounted for in the daily forecast calculation include UV reflectivity and surface pollution and aerosols. Generally, with the exception of snow and sand most surfaces are very poor in reflecting UV radiation. The surface of greatest concern is snow, which is highly (80-90%) reflective at all UV wavelengths. So even in mid-winter, exposure to reflected UV radiation upon a snowy field or at high altitudes while skiing can double or triple the amount of direct UV normally received without snow. Sand is somewhat reflective depending upon the type, size and color of the grains. Air pollution and aerosols act upon UV radiation by absorbing or scattering it. Their net effect is to decrease the amount of UV radiation reaching the surface. Reflection will Intensify UV Exposure2
|
 |
| Figure 2 |
|---|
The Ultraviolet Index, produced by the National Weather Service, is a calculated prediction of the amount of skin-damaging UV radiation that will reach a specific location (1m2) during the solar noon hour, 11:30 a.m. to 12:30 p.m. (local standard time). The World Meteorological Organization has designated one UV Index Unit as 25 mW/m2 or 90J/ m2/hr. This prediction is derived from the combination of five elements: 1) latitude, 2) day of year, 3) total ozone overhead, 4) elevation above sea level, and 5) amount of cloud cover. For a more detailed explanation of the elements and a graphic illustration of these factors see Tables 2 and Figure 2.
| Table 3. ULTRAVIOLET INDEX ELEMENTS Order of Combination and Calculation4 |
|---|
UV calculation for hypothetical location
|
| Table 4. The EPA UV Index Exposure Categories | |
|---|---|
| UV Index | Exposure Level |
| 1-2 | Minimal |
| 3-4 | Low |
| 5-6 | Moderate |
| 7-9 | High |
| 10 and greater | Very High |
 |
| Figure 3 |
|---|
The qualities of these five elements and an example of the way they are combined to calculate the final prediction integer/exposure level is detailed in Table 3. The EPA further categorizes the numerical UV Index into five exposure levels from Minimal to Very High. (Table 4) Action steps to prevent overexposure are recommended by the EPA and displayed in icon form.[
8] These include: Limit Time in The Midday Sun: Whenever possible limit exposure to the sun between the hours of 10AM and 4PM.Seek Shade: staying undercover is the best protection. Remember the Shadow Rule: Watch your shadow -no shadow seek shade! Always use sunscreen: liberally apply a broad-spectrum sunscreen with SPF of 15 or greater, reapply every 2 hours. Wear a Hat: A hat with a wide brim protects vital areas of face, ears, eyes, and neck. Cover Up: Tightly woven loose fitting, full-length clothing offer additional protection from the sun's rays. Wear Sunglasses: Choose those that block 99-100% of the UVA and UVB radiation. Fully protective glasses will reduce exposure, which can lead to cataracts.
When combined in a graphic format and calibrated to the level of exposure, these icons provide a quick and useful guide for use by all ages[
9] (Figure 3).How is the UV Index disseminated?
The Ultraviolet Index values are made available daily by 2 p.m. EST for the following day via the NWS Weather Wire and are published on the
NWS Ultraviolet Index homepage and the Interactive Weather Information Network. Local newspapers often purchase the entire weather/meteorological maps and national temperature data from privatized companies who usually integrate the UV Index and light skin/dark skin times-to-burn information into the weather page format under the "Sun Danger", "Sunburn Index", or "Ultraviolet Index".The accuracy of the UV forecast is well established. It has been validated by ground station measurements, being within +1UVI unit 68% of the time during the peak summer months.[
10]Usefulness of the UV Index
In today's data-rich environment, the UV Index would seem to be inconsequential, but daily repetition may increase awareness and behavior. The Canadian experience is a case in point. Canada began broadcasting its version of the Ultraviolet Index in May 1992. Their index is quite comparable to the one used in the USA in method of calculation, form of reporting, and the frequency with which people report hearing of it. A 1993 survey of 1200 Canadians found 73% were aware of the index with 59% of respondents indicating that the UV Index had influenced their sun exposure habits.[
11] A 1996 survey of 4,023 Canadians noted that 90% of the respondents heard or saw information on the UV Index during the summer months with 50% of all sampled indicating "extra precautions taken" when the UVI was high (7-8.9 in the Canadian system). The authors concluded that specific messages about sun protection can be successful in promoting sun protective actions among the general public in Canada.[12] Earlier US studies found that nearly two-thirds of the US public had heard of the UV Index and 40% stated that it was useful in changing their sun protection practices.[6,7] |
| Figure 4 |
|---|
 |
| Figure 5 |
|---|
Linking raindrops and photons (Figure 4) can allow the Ultraviolet Index to be compared to a weather service prediction for precipitation. (Figure 5) A "drizzle tomorrow" forecast suggests minimal preparation (wear a hat) whereas "heavy rain in the afternoon" indicates the additional need to carry galoshes, raincoat, and umbrella. Likewise, an Ultraviolet Index of 2 requires "minimal" protection (a hat only), while an Index of 6 calls for "moderate" protection (hat, sunscreen, sunglasses, full-length clothing, and seeking shade). What is so paradoxical is that most would characterize "heavy rain" as a "bad" day while considering a cloudless, bright sunny day as "perfect."
Using the Ultraviolet Index as an educational tool as well as a daily reminder, physicians have the opportunity to point out the pattern of intense midday irradiation and to reinforce the recommendations for protection. For the purposes of early intervention/prevention and education, this opportunity is especially important when dealing with parents, teachers, school board members and child care givers as an 80% reduction in skin cancer has been predicted if sunscreens are used during childhood.[
13]In an effort to target youth, the EPA has developed the SUNWISE SCHOOL PROGRAM.[
14] The UV Index will be an important part of this program piloting in 1999 and scheduled for national use in the 2000-2001 school year. Along with this government program, there are many other local programs aimed at modifying sun protection practices.[15,16]Potential Venues for the Ultraviolet Index
A South Florida experience illustrates the value of the UV Index. In 1996 the local dermatological community, in conjunction with motivated citizens (The Richard David Kann Melanoma Task Force, Inc. of Palm Beach County) convinced the local school administration of the value of daily announcement of the Ultraviolet Index. A 7-minute video was created for the teachers and the Parent Teacher Associations explaining the 5 elements of the Ultraviolet Index and the importance of appropriate protective steps. Each school received a copy of the video. With the EPA's help, a "Be Sun Wise" chart, What Is the Ultraviolet (UV) Index?, was provided to all 9,000 teachers countywide. Each school was given an enlarged poster of this same chart which, by direction of the school administration, was to be mounted in a prominent, protected display area in each of the 133 schools. Beginning in September 1996, the Ultraviolet Index has been announced daily during morning assembly. Teachers and coaches are reminded of the need for sun protection before field trips and other outdoor activities.
Much more can be done with this information. Potential venues could include preschools and day camps that could utilize the UV Index for planning daily activities. Golf and tennis facilities could display the UV Index prominently at the entrance of the Pro shop. Local festivals, fairs and shows (e.g., flower shows) could feature a large poster at the ticket booth or entry point displaying the daily UV Index to remind all of those who enter of the sun's strength and appropriate protections for that level. (Figures 3,4)
Use of the Ultraviolet Index could be integrated into the dermatology environment by prominently displaying the Ultraviolet Index each day at conventions. The AAD could produce graphics depicting its use on the Web and could encourage the media to display better graphics expanding the presentation and explaining the likeness of the UV Index to other weather predictions.
Dermatologists can help to increase the knowledge and value of the UV Index as a daily reminder of the sun's intensity by displaying the UV Index number in office waiting rooms. Local dermatological societies, in cooperation with concerned citizens, and backing from our national organizations could disseminate the UV Index to further the National Skin Cancer agenda.[
15]Once the UV Index is fully explained it will become the useful tool envisioned by its creators. Someday we may all consult the Ultraviolet Index as diligently as we check the weather forecast.
For more information and questions about the UV Index for health aspects, contact the EPA at 1-800-296-1996; for scientific aspects, the NWS at 1-301-713-0622.
Many websites include information on the UV Index. Some of the best are listed here.
- Current UV Index Forecast
- UV Index home page Stratosphere: UV Index
- UV Index US Map
- United States - NOAA / EPA Ultraviolet Index Forecast - text forecast
- United States Environmental Protection Agency: Ozone Depletion Home Page
- Minutes to Burn
- NAPEnet
- "SUN-FX365 Å" - Because you need sun protection all year long
- USA Today Weather Page
Addendum
Since its inception in 1994 the UV Index has been made available by a bulletin listing 58 cities throughout the country. This list includes the major city for each state including a few states with two or three major cities. Surrounding towns may use the listed city's UV Index value for their own. Recently (May 1, 2000), the National Weather service has expanded its UV Index products to include a gridded database by which a forecast anywhere in the contiguous US and Alaska may be determined. This will allow the private weather companies to significantly expand and enhance their UV Index products to the public. As with the 58 cities, the gridded database is based on the five elements in Fig. 3. The following is a brief list of excellent private weather companies:
References
1. Parker SL, Tong T, Bolden S, Wingo PA. Cancer statistics, 1997 [published erratum appears in CA Cancer J Clin 1997 Mar-Apr;47(2):68] CA Cancer J Clin 1997;47(1):5-27. PubMed2. Marks R. Skin cancer control in Australia. The balance between primary prevention and early detection [editorial]. Arch Dermatol, 1995 Apr, 131(4):474-8. PubMed
3. Boreland R, Hill D, Noy, S Being SunSmart. Changes in Community Awareness and Reported Behavior following a Primary Prevention Program for Skin Cancer Control. Behavior Change 7(3):126-135; 1990.
4. Long CS, Miller AJ, Lee H-T, Wild JD, Przywarty RC, Hufford D. Ultraviolet Index forecasts issued by National Weather Service. Bulletin American Meteorological Society 77:729; 1996.
5. Koh HK, Geller AC, Miller DR, Grossbart TA, Lew RA. Prevention and early detection strategies for melanoma and skin cancer. Current status [editorial] Arch Dermatol 1996;132(4):436-43. PubMed
6. Media dissemination of and public response to the Ultraviolet Index-United States 1994-1995. Arch Dermatol 133:907-8; 1997.
7. Geller AC, Hufford D, Miller DR, Sun T, Wyatt SW, Reilley B, Bewerse B, Lisco J, Brooks D, Grupenhoff J, Weary P, Lew RA, Koh HK. Evaluation of the Ultraviolet Index: media reactions and public response. J Am Acad Dermatol 1997;37(6):935-41. PubMed
8. Long CS, NOAA, National Weather Service, National Centers for Environmental Prediction. Ultraviolet Index Verification Report-Indications of Surface Ultraviolet Radiation Observation Characteristics. Climate Prediction Center Report; 1996.
9. Action Steps For Sun Protection. EPA430-F99-026,Sept 1999.
10. CantorM, Rosseel K. EPA SunWise School program. personal communication
11. Decima Research. An Investigation of Canadian Attitudes Related to Environment Canada's UV Index. 1993.
12. Lovato C, Shoveller J, Rivers J. National Survey on Sun Exposure and Protective Behaviors: Final Report, Vancouver. Institute of Health Promotion Research University of British Columbia; 1997.
13. 13. Stern RS, Weinstein MC, Baker SG. Risk reduction for nonmelanoma skin cancer with childhood sunscreen use. Arch Dermatol 1986;122(5):537-45. PubMed
14. Cantor M, Rosseel K, Rutsch, L. The United States Environmental Protection Agency SunWise Program. Health Education & Behavior 26:303-304; June 1999.
15. Geller AC. Current Status of Sun Protection Programs. Cosmetic Dermatology 43-47; May 1999.
16. Miller DR, Geller AC, Wood MC, Lew RA, Koh HK. The Falmouth Safe Skin Project: evaluation of a community program to promote sun protection in youth. Health Educ Behav 1999;26(3):369-84. PubMed
17. Goldsmith LA, Koh HK, Bewerse BA, Reilley B, Wyatt SW, Bergfeld WF, Geller AC, Walters PF. Full proceedings from the National Conference to Develop a National Skin Cancer Agenda. American Academy of Dermatology and Centers for Disease Control and Prevention, Washington, D.C., April 8-10, 1995. J Am Acad Dermatol 1996;35(5 Pt 1):748-56. PubMed
© 2000 Dermatology OnLine Journal